Mov-IT Interactive Visualization Tool
Installation
1. Download the Mov-IT application
Select the package corresponding to your system and install or uncompress it:
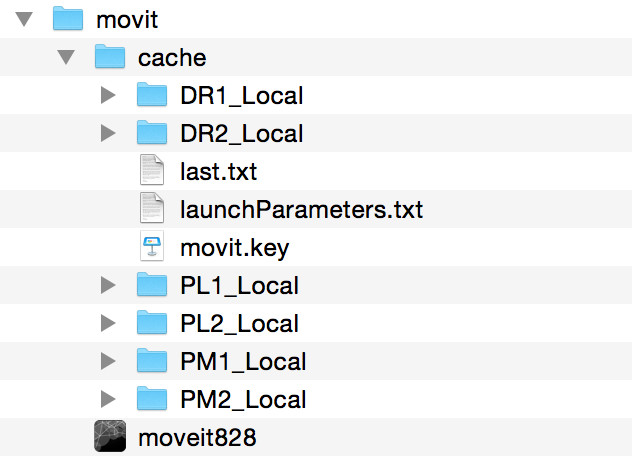
Note: if there is no cache folder inside the installation directory, pre-run the application (double-click on the executable), leave the Login and Password text fields empty by pressing Ok twice, then quit the application.
2. Download a dataset
Select one or several raw data and digital embryo datasets from the datasets' webpage (Paracentrotus lividus and Phallusia mammillata datasets are smaller, hence faster to download) and unzip their contents in the cache folder, which should now look like this:
3. Run Mov-IT
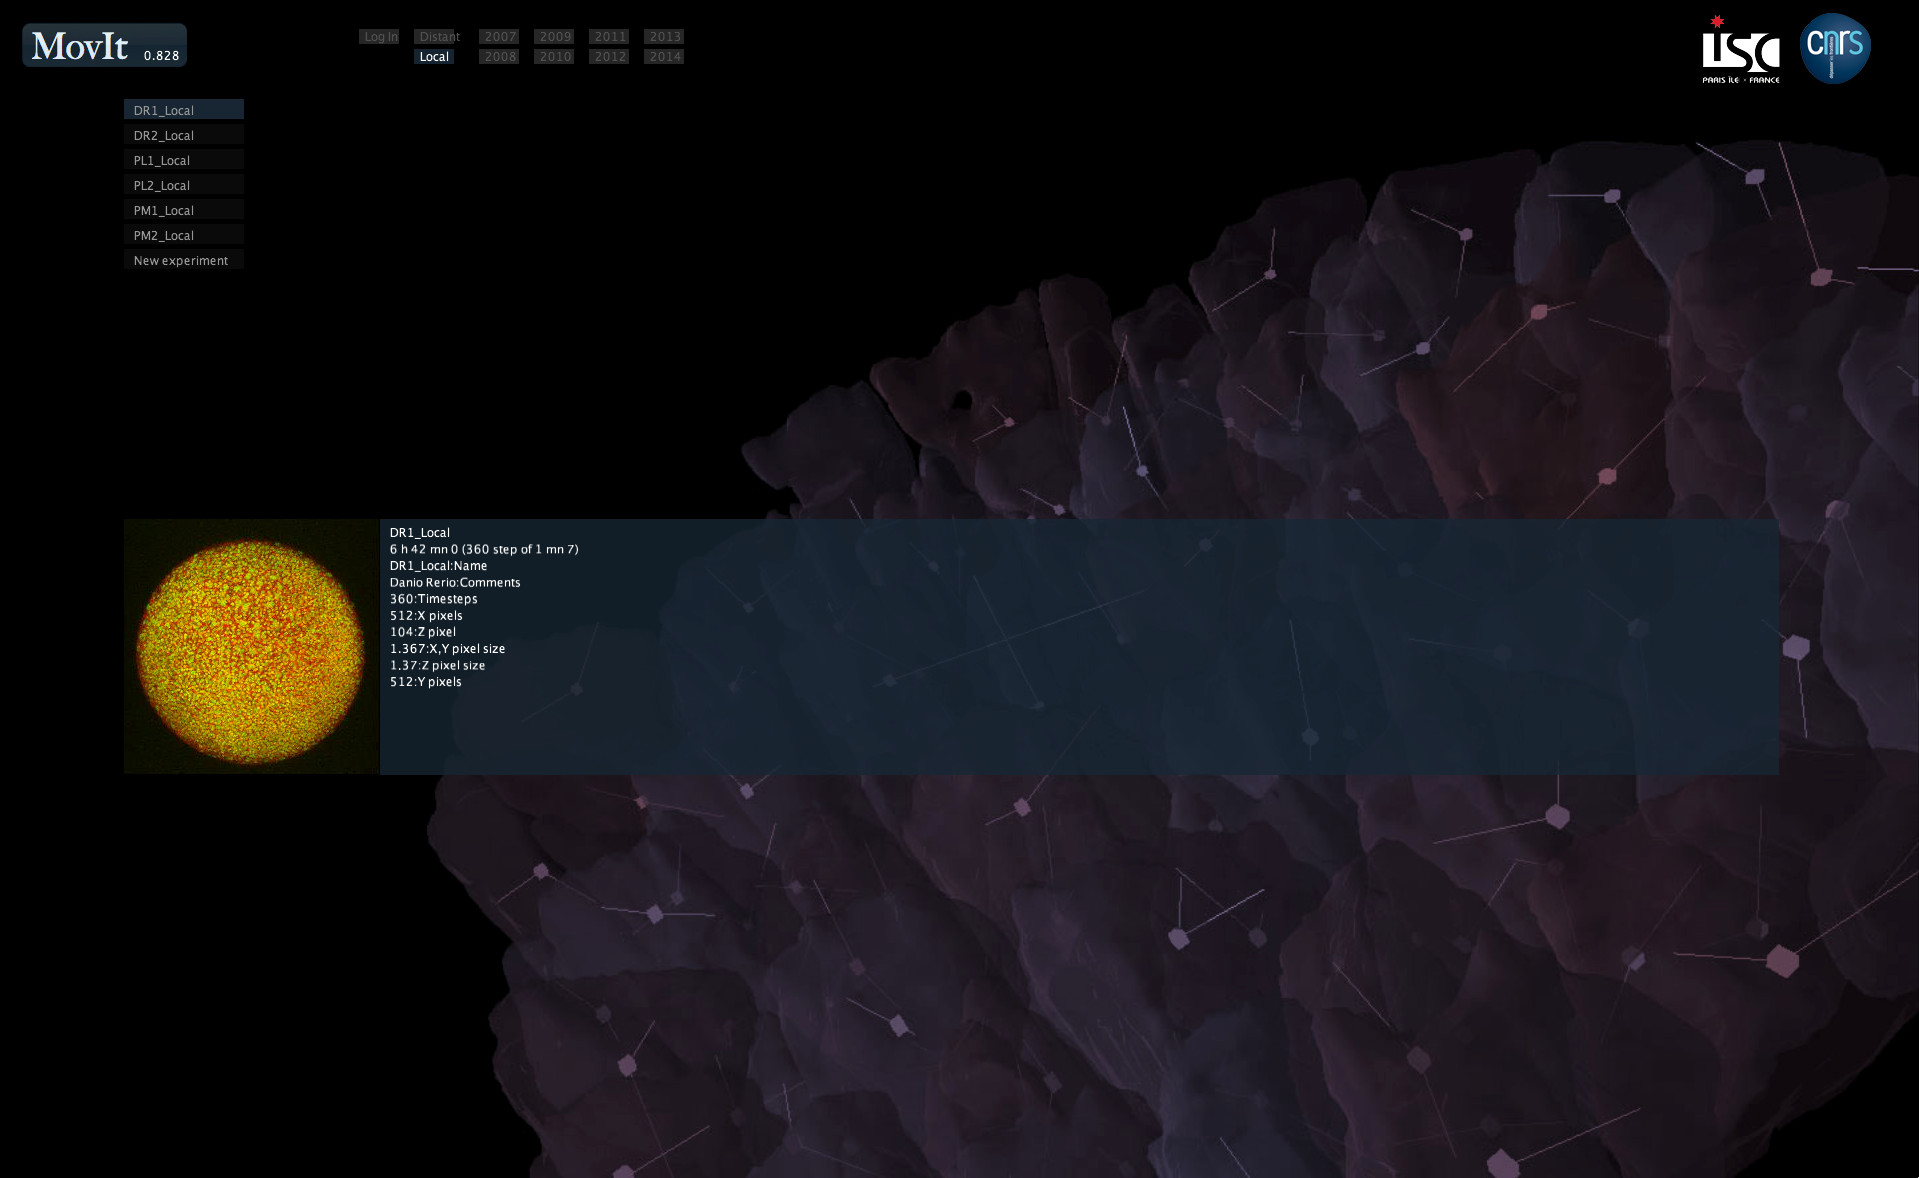
Double-click the executable and select one of the downloaded datasets from the left-hand side margin. The visualization interface opens, displaying the orthoslices in gray levels and the cell centers as small cubes.
To load your own datasets, click on New experiment instead and select one of two possible source formats:
- vtk file (.vtk or .vtk.gz): this option requires to use VTK-formatted datasets that are "homogeneous", i.e. in which the dimensions, format and resolution are constant across all time steps. First, select a VTK or compressed VTK file, then enter a short description for the dataset. Other prompts will request the number of time steps and the interval in milliseconds between two time steps. Finally, your experiment is created and added to the list on the home page.
- previously downloaded experiment (local cache): this option is intended for reuse of a local experiment that was already created as above. An initial experiment serving as a model is requested (new label), then another prompt will suggest a new name to label this experiment.
Quick tour
Moving and navigating
- To rotate an embryo: click, hold and move the mouse at the same time.
- To translate an embryo: hold the ⇑ Shift key and move the mouse (without clicking).
- To zoom in/out of an embryo: use the mouse wheel, or hold the Alt key and move the mouse up and down (without clicking).
- To navigate along the cell tracking back and forth through time: use the up arrow ↑ and down arrow ↓, or hold the ⇑ Shift key and use the mouse wheel (without moving the mouse).
- To focus on one cell: "right-click" on it.
- To keep the focus on the same cell along the tracking: hold the ⇑ Shift key while using the up arrow ↑ and down arrow ↓.
Cell tracking
- To view the cell tracking: press the slash key /.
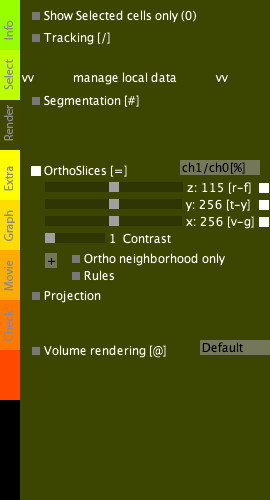
- To access more tracking view options: point to the Render tab (in the vertical orange-green menu) and check the Tracking box. Use the slider to set the number of time steps to display, and the Forward button to select the navigation mode (forward, backward, or both).
Orthoslices
- To view the orthoslices: press the equal key =.
- To access more orthoslice view options: point to the Render tab (in the vertical orange-green menu) and check the Orthoslices box. Press % or ch1/ch0 to switch between channels. Check/uncheck the boxes at the end of each axis to activate/deactivate the display of the corresponding plane.
- Use the G/V, or T/Y, or R/F keys to move an orthoslice along the x, or y, or z axes respectively.
Tutorial
A menu bar (vertical orange-green tabs) offers access to main properties and functions. Menu tabs are automatically selected by flying the mouse over them.
Info tab
|
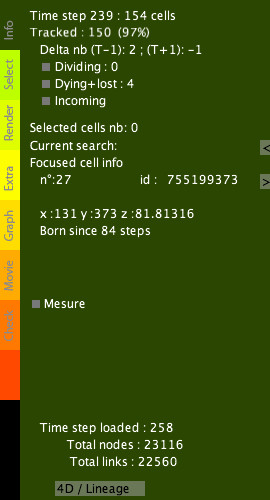
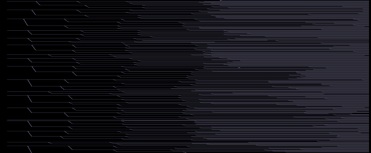
The Info tab displays the number of cells at the current time step, the number of tracked cells with respect to the next time step, and the difference in cell number with the next time step. Info tab options:
Example of lineage tree layout in a digital embryo |
Select tab
|
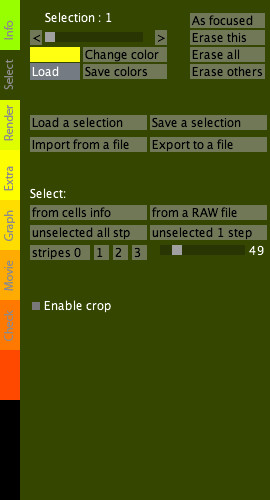
The Select tab is dedicated to the management of "selections", i.e. groups of cells that can be targeted and labeled with different colors in order to visualize and analyze subpopulations of cells.
Select tab options:
|
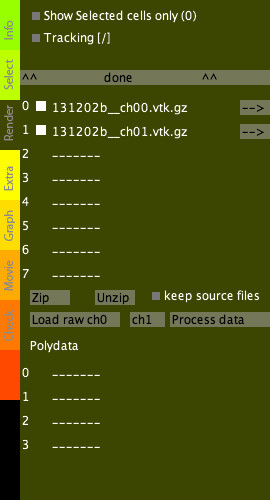
Render tab
|
The Render tab allows superposing cell centers and trajectories (tracking) with the raw data.
Tracking options:
Orthoslices options:
Volume rendering options:
|
Extra tab
|
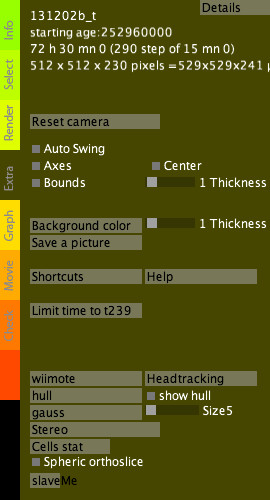
Extra tab options:
|
Graph tab
|
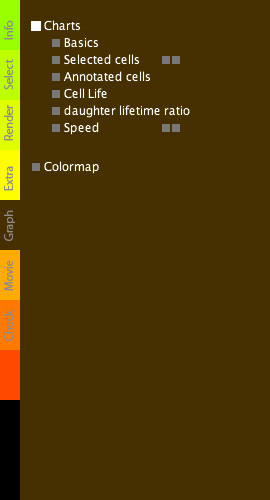
Charts options:
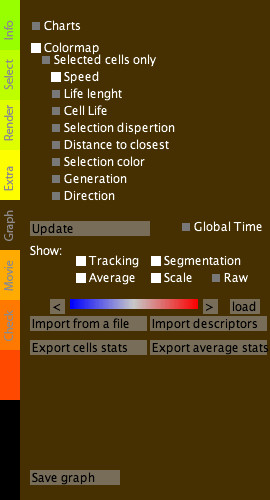
Colormap options (to color cells by their features):
|
Movie tab
|
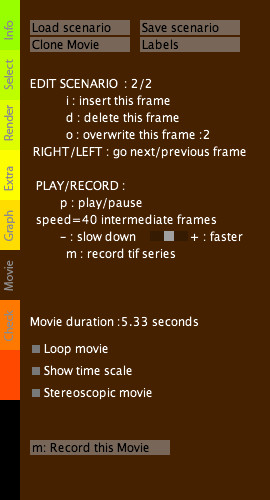
You can create an image sequence using Mov-IT very easily. Choose a time step of interest, camera position and orthoslices then press the I key to add the first frame of your movie. You can add as many frames as you want with different camera positions, orthoslices or time steps. Once at least two frames have been added, the extended menu appears. Press D to remove a frame, or O to update it. You can switch between frames using ← or →. Mov-IT will automatically add frames between keyframes you added. The default number of frames added for interpolation is 40, but you can increase or decrease this value as you wish (+ and - keys). Press M to create the image sequence. Files will be stored in the Mov-IT folder. You can use image Software such as Fiji or ImageJ to create a movie. |
Check tab
|
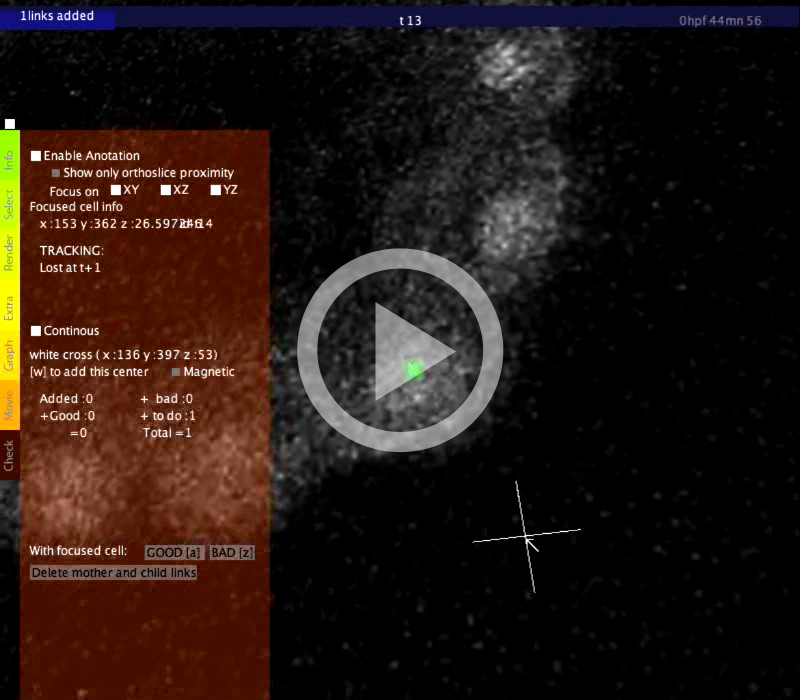
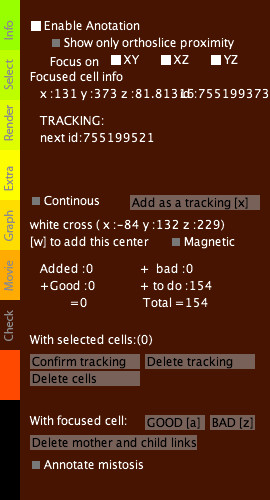
Warning: there is no undo command. Annotation mode (click on the check box Enable Annotation) allows you to access the tracking information, to correct manually an erronated link or to create an new link (a link represents the correspondence between two cells of consecutive time steps). You can confirm or infirm centers detected automatically (if a center is correct hit A, if it is incorrect hit Z). You can add centers with W or move a focused center (right click a cell) with J. You can also cut, modify or add links between related centers along the timeline. When the enable annotation mode is active, the focus stays on the chosen cell when you move through the timeline. When you click on a center, a transparent cube appears. When you move forward or backward along the timeline (↑ and ↓ arrows) the cube follows the tracking links. This allows you to follow a chosen cell along the timeline. To be sure that you are really following the cell, you can superimpose raw data and centers (see Render tab). Addition of new centers/manual trackingIf some centers are missing or if you want to perform a manual tracking, move the cursor over a cell (visualized with orthoslices) and hit W. If the center is correct and you wish to annotate it, hit A. As for the automatically detected centers, you can displace them hitting J. Correction of linksFocus on a center by right-clicking on it. When you move from the current step to the next one (↑ and ↓key) and the link seems correct (according to the raw data), you can positively annotate it with the Q key. If the link is incorrect click on delete mother and child (delete the link between t and t+2) or click on delete tracking to delete the link between t and t+1 only. To add a new link, point on a center at each time step and hit S. To finalize the addition of the links, hit X. When a cell divides, select the mother and the two daughters (not more) and hit X. Annotate mitosisIt allows you to display a selection of all the detected mitoses. Then compare with the raw data and validate the mitoses by hitting I or clicking on validate mitosis. You can switch between dividing cells using ← and → arrows. |
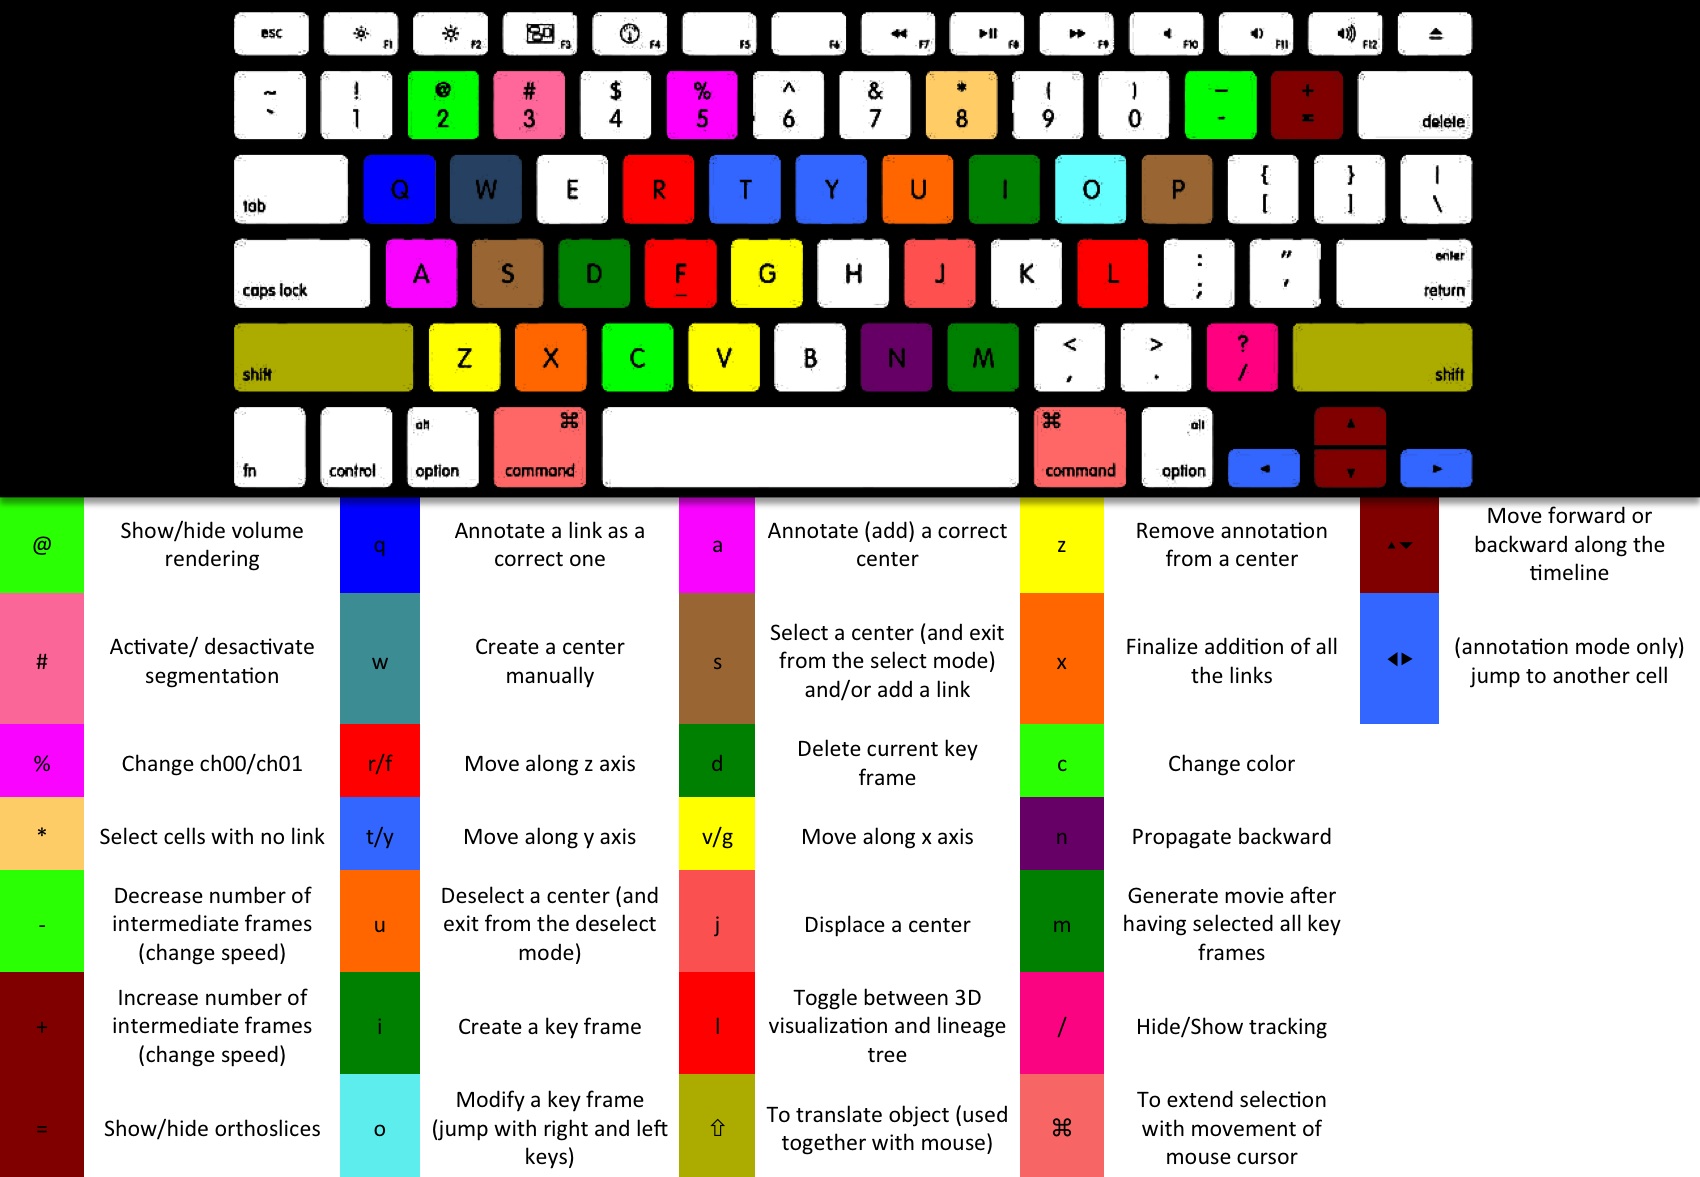
Shortcuts
Demo
